Overview of Washington Taxes
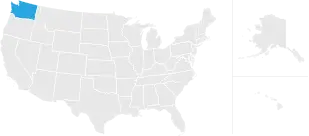
Washington State has property tax rates somewhat below the national average. The state’s average effective tax rate is 1.06%.
| Enter Your Location Dismiss | Assessed Home Value Dismiss |
| Average County Tax Rate 0.0% | Property Taxes $0 (Annual) |
| of Assessed Home Value | |
| of Assessed Home Value | |
| National | of Assessed Home Value |
- About This Answer
To calculate the exact amount of property tax you will owe requires your property's assessed value and the property tax rates based on your property's address. Please note that we can only estimate your property tax based on median property taxes in your area. There are typically multiple rates in a given area, because your state, county, local schools and emergency responders each receive funding partly through these taxes. In our calculator, we take your home value and multiply that by your county's effective property tax rate. This is equal to the median property tax paid as a percentage of the median home value in your county.
Washington State Property Taxes

Property taxes in Washington State are limited by a number of laws that put caps on the amount homeowners can be taxed, and the amount those taxes can increase in a given year. Specifically, the total of general, non-voter approved taxes cannot be more than 1%, and the total tax levy in an area cannot increase by more than 1% in a year.
Looking to calculate your potential monthly mortgage payment? Check out our mortgage loan calculator.
As a result of those rules, Washington State has tax rates somewhat below the national average. The state’s average effective tax rate is 1.06%. Read on to learn more about property tax rates and rules in Washington State.
How the Property Tax works in Washington State
In Washington State, taxes on real estate account for about 30% of all state and local tax revenues. Property taxes pay for local services like fire protection, public schools and parks.
Taxes on an individual property are based on two factors: the assessed value of the property and the total tax rate that applies to that property. Assessed value is determined through annually revaluations based on market data, and physical inspections that take place at least once every six years.
Tax rates apply to those assessed values. They are calculated based on the total of assessed value in a given tax district, and the total budget of a given taxing authority. So, for example, if the sum of assessed values is $500,000 and taxing authority needs revenue of $2,500, the rate would be 0.5%.
Increases in a given taxing district’s levy are limited to 1% per year or the rate of inflation, whichever is lower. Thus, if a county’s budget this year is $3,000, next year it cannot be more than $3,030. That limit does not apply to new levies, or in other special cases like annexation or new construction.
Washington State Property Tax Rates
Property tax rates in the Evergreen State can be divided into two groups: general, non-voter approved rates, and voter-approved special levies. Non-voter approved rates are used to support the ongoing functions of municipalities and counties, while voter-approved levies have specific purposes (funding a parks district, for example).
The Washington State Constitution limits the total of all non-voter approved property tax rates to 1% on a given property. Even if your county rate is 1% and your city rate is 0.75%, your total general rate will still be 1%. There is no limit on voter-approved levies, so it is common for a total rate to exceed 1%.
Tax rates in Washington State are expressed in dollars per thousand in assessed value, equal to one-tenth of a percent. The table below shows the effective tax rate for every county in Washington State. The effective rate is the amount paid annually as a percentage of home value.
If this tax structure appeals to you and you’re looking to buy property in Washington, or simply looking to refinance your current home loan in the state, take a look at our mortgage guide. It contains comprehensive information on mortgage rates and getting a mortgage in Washington.
King County
With a population of more than two million, King County is the largest county in Washington State. It stretches from the Puget Sound west to Cascade Mountains at Snoqualmie Pass. The county’s largest cities are Seattle and Bellevue.
The average effective property tax rate in King County is 0.99%, 23rd highest of the state’s 39 counties. However, the county’s median annual property tax payment is highest in the state, at $4,024. In Seattle, the total 2018 rate was $9.56 per $1,000 in assessed value, a 3.4% increase from 2017. Rates in many King County cities have been falling as home values have been increasing. (Since there is a cap on the growth in levies, steep increases in home prices are often balanced by falling rates.)
Pierce County
Located between the south end of Puget Sound and Mount Rainier National Park, Pierce County has the highest property tax rates in Washington State. The county’s average effective tax rate is 1.24%. Property taxes have increased in recent years, but these increases have primarily been the result of new voter-approved levies to support things like the construction of new school buildings. General levies, capped at 1% increase per year, have remained steady.
Snohomish County
Snohomish County lies directly north of Seattle and King County and contains the city of Everett. The median annual property tax in Snohomish County is $3,251, second highest in the state, and about $1,000 higher than the national average.
In the city of Everett, the typical property tax rate for 2017 was $12.2180 per $1,000 of assessed value.
Spokane County
Eastern Washington’s Spokane County has property tax rates close to the state average. The county’s average effective tax rate is 1.20%, slightly higher than the state average of 1.06% but below the national average of 1.19%.
In the city of Spokane, the total 2015 levy rate was around $14.5 per $1,000 of assessed value. That means that the taxes on a city with an assessed value of $100,000 would be about $1,450 annually.
Clark County
Clark County is located along the Columbia River, just north of Portland, Oregon. Its largest city is Vancouver. It is named for the early 19th century explorer, William Clark. The median annual property tax paid by homeowners in Clark County is $2,778, fifth highest in the state and nearly $600 higher than the national median.

Thurston County
Situated at the south end of the Puget Sound, Thurston County is a largely rural county but contains the state capital, Olympia. The average effective rate in the county, which was around the state average just a few years ago, has steadily risen to 1.11%. In Olympia the total 2018 tax rate is about $15 per $1,000 in assessed value. The largest recipient of tax in Olympia is the public school district. The school tax alone is $5.12 per $1,000 in assessed value.
Kitsap County
Kitsap County is located on the Kitsap Peninsula in the Puget Sound. It also includes Blake Island and Bainbridge Island (which is connected to Seattle by way of a ferry). The median annual property tax paid by homeowners in Kitsap County is $2,722. That is the sixth highest median tax in the state.
Yakima County
With a population of about 250,000, Yakima County is the eighth largest county in Washington State. It is located in central Washington, just east of the Cascade crest. According to the U.S. Census Bureau, the median home value in Yakima County is $160,700, among the lowest in the state. So, while tax rates in Yakima County are close to average, tax payments are relatively low. The median annual property tax payment in the county is $1,692, 13th lowest in Washington.
Whatcom County
Whatcom County sits in the northeast corner of Washington State, along the Canadian Border. It has property tax rates well below the state average. The Whatcom County average effective property tax rate is 0.89%, 14th lowest in the state and well below other counties in the Puget Sound region.
Benton County
Situated along the Columbia River in eastern Washington, Benton County has property taxes somewhat lower than the state average. The median annual property tax paid by homeowners in Benton County is $1,970. That’s about $900 lower than the state median, and $225 lower than the national median.
Places Receiving the Most Value for Their Property Taxes
SmartAsset’s interactive map highlights the places across the country where property tax dollars are being spent most effectively. Zoom between states and the national map to see the counties getting the biggest bang for their property tax buck.
Methodology
Our study aims to find the places in the United States where people are getting the most value for their property tax dollars. To do this, we looked at property taxes paid, school rankings and the change in property values over a five-year period.
First, we used the number of households, median home value and average property tax rate to calculate a per capita property tax collected for each county.
As a way to measure the quality of schools, we analyzed the math and reading/language arts proficiencies for every school district in the country. We created an average score for each district by looking at the scores for every school in that district, weighting it to account for the number of students in each school. Within each state, we assigned every county a score between 1 and 10 (with 10 being the best) based on the average scores of the districts in each county.
Then, we calculated the change in property tax value in each county over a five-year period. Places where property values rose by the greatest amount indicated where consumers were motivated to buy homes, and a positive return on investment for homeowners in the community.
Finally, we calculated a property tax index, based on the criteria above. Counties with the highest scores were those where property tax dollars are going the furthest.
Sources: US Census Bureau 2018 American Community Survey, Department of Education
